I've been requested to look at the Tesla chart and give my breakdown of it. One note - I do not buy, nor is my portfolio trade/technical based. I pick/buy my companies on fundamentals. The reason for the charts is the *when* to buy, not what to buy. That said, I have not and do not claim to follow this stock. I have not read the balance sheet, do not listen to corporate earnings calls, nor any of the other research I do for the stocks listed in my portfolio. This is simply a chart read.
That said - to the chart.
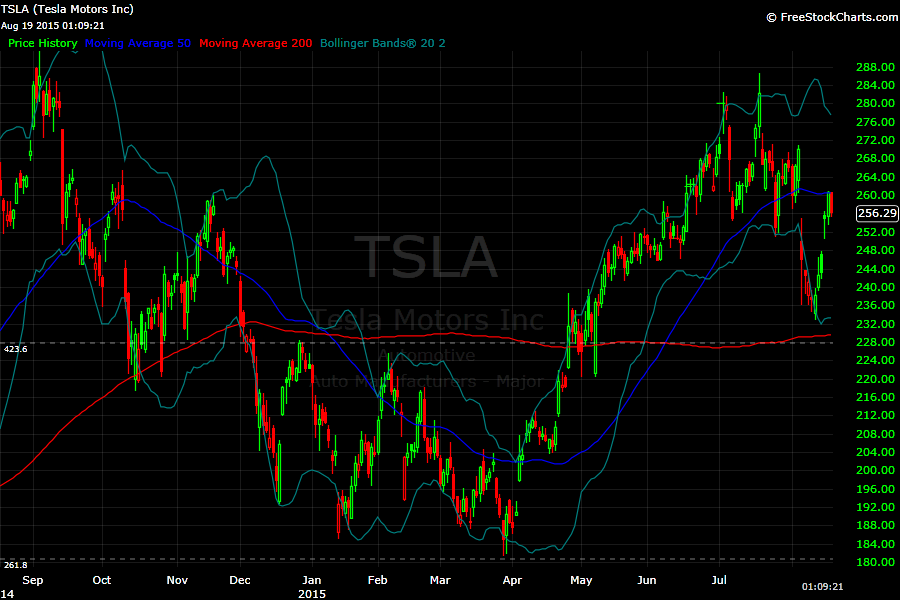
A look at the one year chart shows Tesla in a range since hitting a high of 284 in September of '14. The current price of 256 is no great 'discount' to that price and is sitting just below the 50 DMA, but firmly above the 200 DMA. This is clearly not a proper technical level to enter the stock. I'd rather buy *above* the 50 DMA at 260+ than buy in this no man land range between the moving averages. Repeat - do not enter stocks for the first time when they are trading between the moving averages. Begin investments on firm footing of a bull move or a bear sell-off.
Look for a break down towards the 200 DMA for Tesla. Target entry of 230 to begin deploying capital. Any break below the 200 DMA is a good time to start investment in this stock.
That said - to the chart.
A look at the one year chart shows Tesla in a range since hitting a high of 284 in September of '14. The current price of 256 is no great 'discount' to that price and is sitting just below the 50 DMA, but firmly above the 200 DMA. This is clearly not a proper technical level to enter the stock. I'd rather buy *above* the 50 DMA at 260+ than buy in this no man land range between the moving averages. Repeat - do not enter stocks for the first time when they are trading between the moving averages. Begin investments on firm footing of a bull move or a bear sell-off.
Look for a break down towards the 200 DMA for Tesla. Target entry of 230 to begin deploying capital. Any break below the 200 DMA is a good time to start investment in this stock.
 RSS Feed
