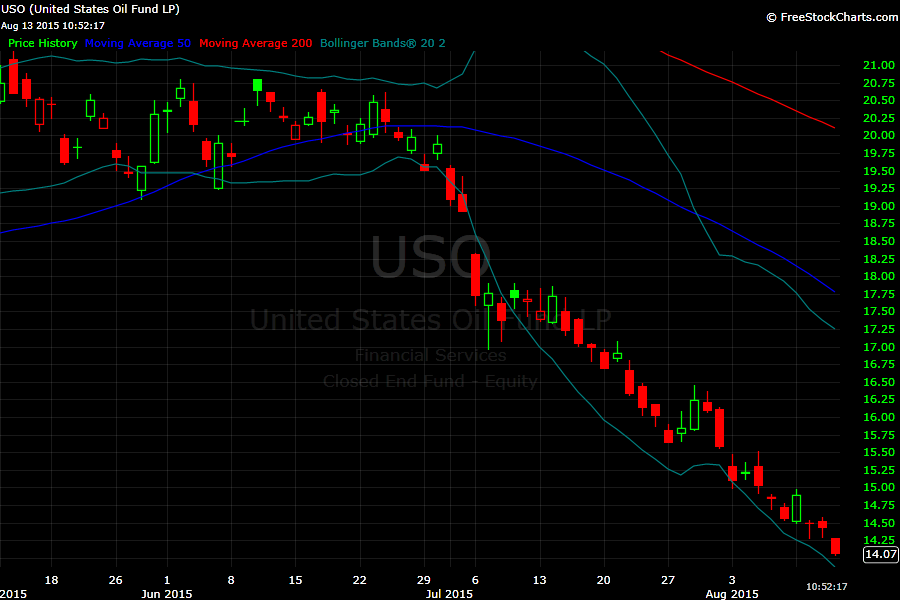
The chart for #WTI (West Texas Intermediate Crude Oil) is about as bad as it gets. This is reflected in the $USO chart, which tracks crude oil. It makes new lows on a daily basis and is bringing 40 closer and closer. Will we reach it next week, perhaps?
If you own oil stocks, this chart has to be a concern. However, I do believe this price dip is temporary and not a permanent 'new normal' the analysts speak of on the television. Oil is a finite resource so ultimately, it can't remain at these depressed levels for long. Be patient with you oil stocks. I believe the worst is over. No, 'belief' isn't an investment strategy, which is why I'm watching this chart. Watch 40.
If you own oil stocks, this chart has to be a concern. However, I do believe this price dip is temporary and not a permanent 'new normal' the analysts speak of on the television. Oil is a finite resource so ultimately, it can't remain at these depressed levels for long. Be patient with you oil stocks. I believe the worst is over. No, 'belief' isn't an investment strategy, which is why I'm watching this chart. Watch 40.
 RSS Feed
