|
Apple was down on an otherwise up day on Wall Street - in fact, the only stock that I follow that was down, quite the bearish sign. On the chart below, we see Apple testing the 106 range for the third time. Usually, test number three fails. I don't know if 106 will hold this time. If not, watch the 200 DMA at 100 (where the rising moving average will be in a few days) 100 would be an excellent entry point for those that have been waiting to buy Apple. 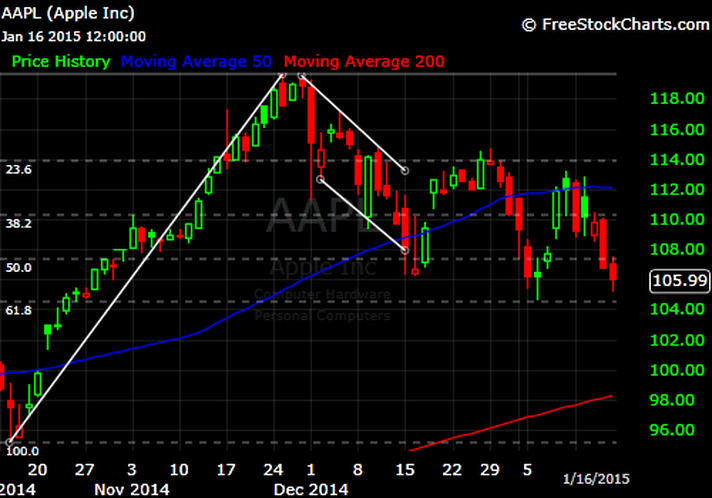 The rally on Friday brought Google to the upper end of a two month down channel. Next week will tell if the stock can bust out of that range. It has once in these last two months, only to fall back down. If you asked me - Google will break above this down channel, but not for long. Sell any strength. 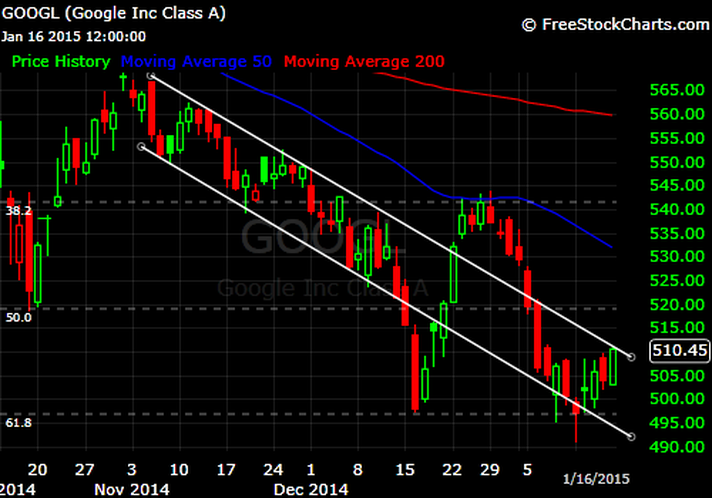 Google has set fresh 52 week lows today and looks to go much lower if the current trend isn't reversed immediately. This crash in Google presents questions for investors. What if you own at a higher level, do you hold or sell? Do you buy more? What about those that do not have a position in Google? Is now a good time to buy? For those in both camps - the answer is the same - let's go to the charts. The first chart shows Google entering a pronounced downtrend - with successive lower highs and lower lows - a telling bear sign. By all accounts - the most likely direction of this stock in the short term is down. So, how far down and when can an investor start buying? 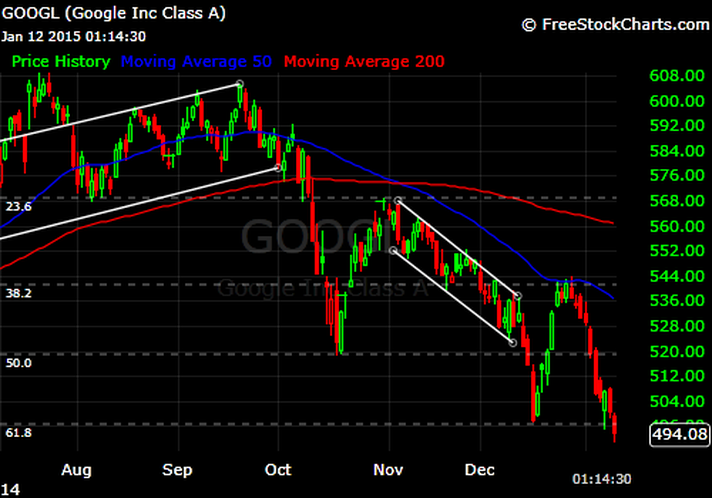 Looking at the year chart, we can see how far Google has fallen. Based on this chart - we go south. To see how much, look at the final chart below. 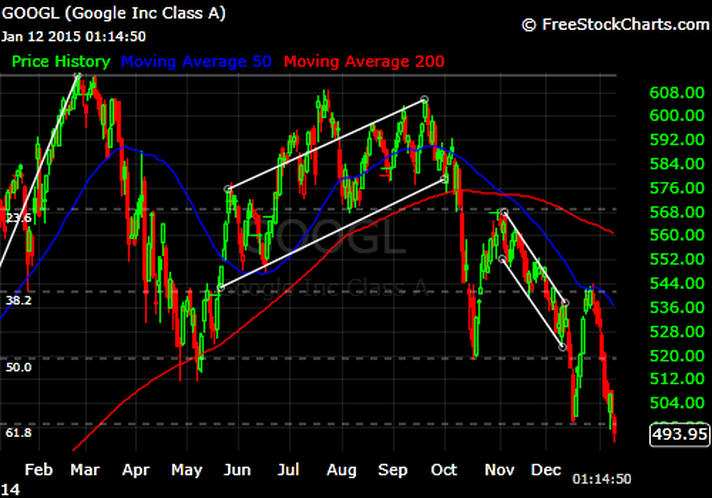 This five year chart of Google shows a very telling move in the stock - from 425 to 525 - largely without any tests. Why is that important? Because on the way down, stocks tend to test resistance points. And Google doesn't have any test points between 500 and...425. So, quite likely, the stock could drop into the mid to low 400s. It's not crazy to suggest we could see a 3xx print in the near future. When Apple went through a similar decline, I advised patience and discipline. Don't rush in unless you weigh the risks and rewards. Buying now isn't a huge mistake long term in my opinion, however, you may see wild short term fluctuations in the price of the stock. Keep that in mind if you put money to work here. Buying a crashing stock can be quite lucrative, but also put your investment chops to the test. 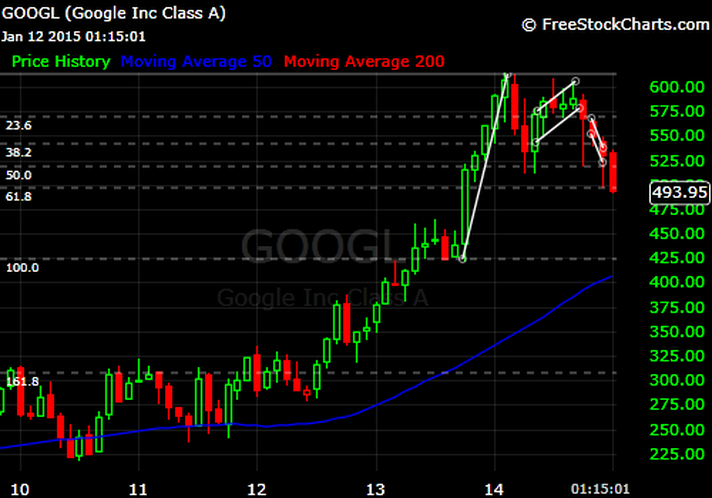 There's been a bull market on Wall Street for the last few years, but over the last 52 weeks, Google has stopped participating. It's been left behind, making a series of lower highs and lower lows. When Apple went through this funk a while back, I kept telling people the price would 'drop until it stops'. Meaning - nobody can call the bottom. The irony is I *did* call the bottom in Apple, but it's a matter of sheer luck. With Google, all I'll say is the stock looks like it wants to go lower. How much lower I can't say exactly. However, I would be stunned in 500 held. I don't believe it will and it's my opinion Google is a buy below 500. 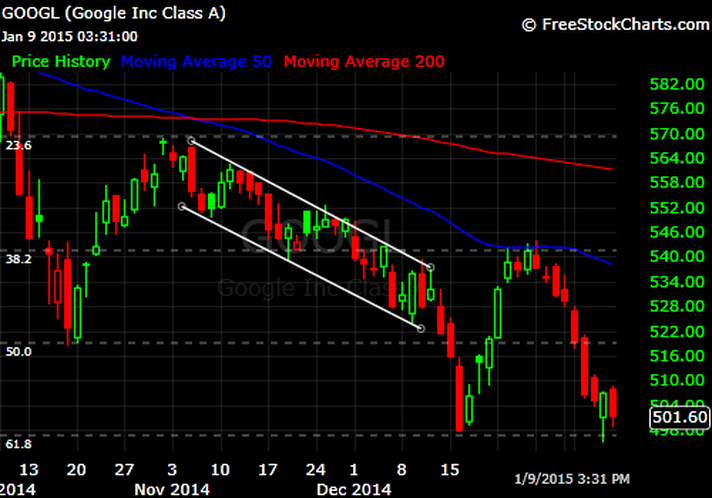 Sometimes you learn a lot in a single trading session. Today, there was good news in housing, jobs and a small break in the relentless crash of oil. The general market was up strongly in a broad based rally. However, Google still managed to finish negative on a day with a great tape. That's a very bearish sign. I'd be surprised if the recent low of 500 held. If it doesn't...look out below. 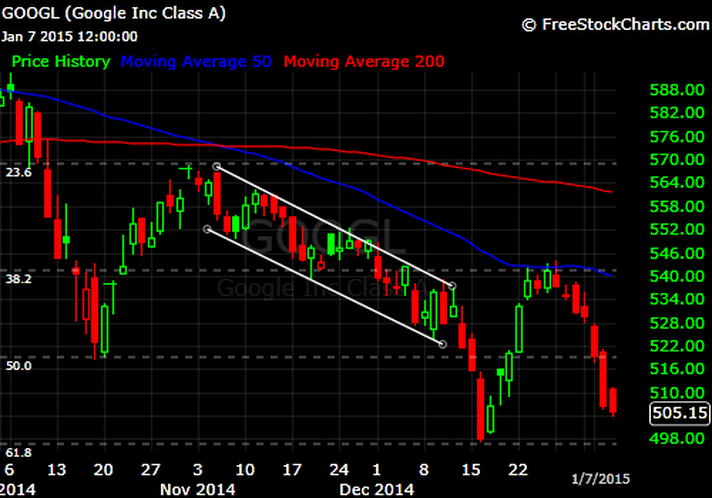 This chart is starting to look like oil. Below 2 Percent on the 10 Year Treasury - Wow.  In the redundancy of the day - I post a crashing oil chart. It does seem as if it's been almost every day this bloodletting of oil prices. It's now over 57% off from the highs of 107 for Texas Crude Oil. This is starting to look like - oil might slide into the 30s. Yes, the 30s are possible for oil. If you had said it 6 months ago, they would have said you were crazy. Now, saying 100 is possible in the next 6 months is the crazy statement. Watch the HUGE, multi-year level of 40 for support. If 40 fails - 33 is the next stop.  Apple made a lower high before resuming it's recent sell-off. I can see a test of 106 coming soon. If 106 doesn't hold, there isn't any support below that number and look out below. You could see serious damage done and 96 would be the new target low. Watch 106. 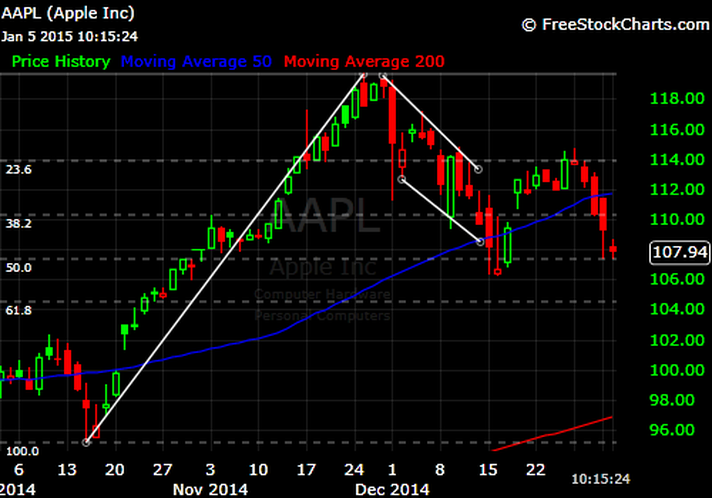 Once again, oil is the headline as the trading week begins. The price of West Texas Crude is off over 3 percent in early trading - below 51 and threatening to head south towards 50. The price of oil has been falling for the better part of 8 months - with seemingly no end in sight. Can the price hold at 50? I just don't see how it can. The chart doesn't show me *any* short term base. Oil attempted to hold 55 and that failed - miserably. I don't think 50 holds either.  |
 RSS Feed
