If you watch the financial channels, you see an endless parade of 'experts' and analysts telling you the same mantra - oil has reached a bottom and it's time to buy both oil and oil related stocks - especially the big integrated names. I've said on my blog these stocks are a buy IF (a big, big IF) oil held the 44/45 range. I posted that advice several times.
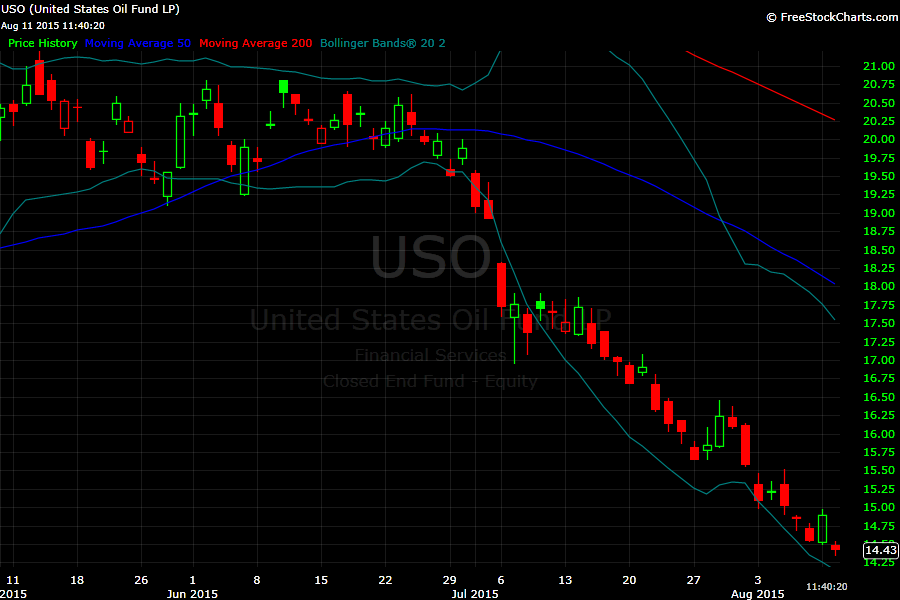
Oil had a nice spike yesterday - a rare green day on an otherwise ugly chart. However, today oil is down - erasing all of yesterday's gains and more. From a technical perspective (chart analysis) - if oil finishes below where it began that big spike of yesterday - that would be a brutal bear signal. So many people calling the bottom in oil - Please tell me where on this chart you see a bottoming pattern? Where do you see evidence of buyers stepping in to pick up this commodity 'on sale'? The few up days are good opportunities to sell and recoup losses, nothing more. Until I see the 50 and 200 DMAs stop freefalling - oil can't be said to have reached a bottom. It's not happening. Hasn't happened. Hoping and praying isn't an investment strategy.
Most of Wall Street is long oil, so I understand why the cheer-leading happens. However, charts don't lie - and the oil chart is broken.
The level oil closes at is massively important today. It must hold the 43 line in the sand. If not - look out below. Again. And again.
 RSS Feed
